

Liquidity and The Wrecking Ball
Liquidity and The Wrecking Ball
Why the USD Will Likely Continue Its Relentless Rally and the Implications for Bitcoin


Disclaimer: Any views expressed in the below text are the personal views of the author/s and do not constitute investment advice or recommendations for investments. The author/s views should not form the basis for making investment decisions - invest in markets at your own risk after performing thorough due diligence.
For any trader or investor, the relative strength of the USD against other global currencies (quantified by the DXY) is perhaps the single most important metric to monitor. The myriad of exogenous inputs that have resulted in the incredible strength of the USD in 2022, has had wide-reaching implications for financial markets alongside global trade and many countries’ spending power and GDP output.
It is widely accepted that DXY strength results in downward price pressure for many liquid and risk assets denominated in USD. This can be noted with the inverse correlation to Bitcoin throughout 2022.
Forecasting and monitoring a potential macro top on DXY is incredibly important when ascertaining an appropriate time to add risk back into our portfolios.

Figure 1 - Graph depicting the inverse correlation between DXY vs. BTC and NDX. Source - TradingView
In the below article, I put forward my thesis for a stronger USD throughout the remainder of 2022 and into early 2023.
Summary
A strong USD (DXY) is generally inversely correlated to the price of risk assets such as Bitcoin. We must understand how the DXY moves in order to time macro market bottoms effectively.
Several different endo/exogenous components drive DXY strength, these are the supply and demand of USD, wider market sentiment amongst speculators and economic data coming from the Fed.
After fully understanding the dynamics of these components, we then must investigate USD liquidity within the private market. The level of which directly affects the propensity for risk assets such as Bitcoin to positively appreciate in a sustainable manner.
Beyond understanding how and why it is likely we see a stronger USD in the months to come, we then must try to forecast the highest probability timing for the DXY index to begin to depreciate. This is done by examining the current stance and language of the Fed at the latest FOMC.
All of the above help to paint a much clearer picture of the wider market conditions of which we are all currently beholden, and help us gauge when to begin transitioning into a bullish stance from a defensive one.
Thesis Origins - The Wrecking Ball
To begin piecing together my thesis for a stronger DXY over the coming months, it is imperative that we first examine all of the various inputs and driving forces which lead to the strength.
1. Supply/Demand
When the US exports goods and services to other countries, the demand for DXY rises as consumers must pay for exports in USD.
Perhaps the most poignant example of this in recent times is the energy mix in Europe throughout the ongoing Russia/Ukraine conflict. The US became the largest LNG (Liquified Natural Gas) supplier to the EU and UK in 2021, accounting for 26% of total imports.
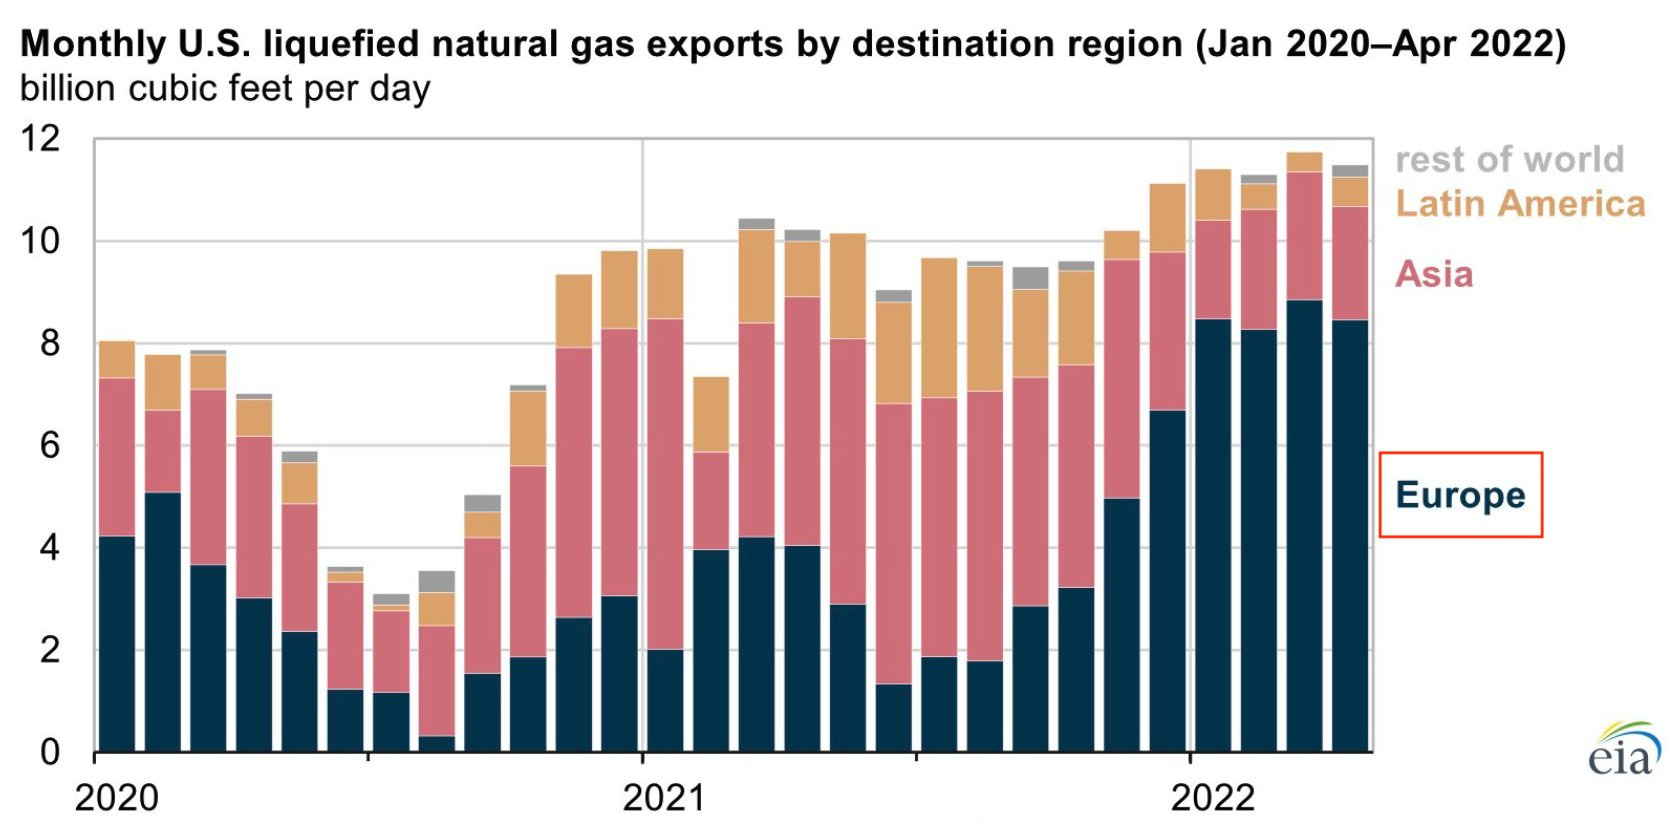
Figure 2 - US export destinations for LNG 2020-2022. Source - US Energy Information Administration (EIA)
In Q1 of 2022, LNG imports from the US to the EU and UK tripled, compared with early 2021, accounting for 49% of total imports. Interestingly, during the same timeframe, the comparative volume of LNG exports from the US to countries outside of Europe has fallen.

Figure 3 - US LNG exports comparing EU countries to the rest of the world. Source - US Energy Information Administration (EIA)
This dramatic change in the export patterns for US LNG towards a convenient purchaser of last resort builds into my thesis for the US being the dominant perpetrator in the Nordstream 1/2 pipeline sabotage, which I wrote about extensively on Twitter in late September.

In addition to the above point on US energy exports; when the US government or large corporations issue bonds to raise capital, foreign purchasers will also need USD to make payments. I’ve found that generally, the investor demographics of US bonds/treasuries comprise a larger cohort of foreign investors during periods of economic uncertainty, further strengthening the DXY and perpetuating a feedback loop.

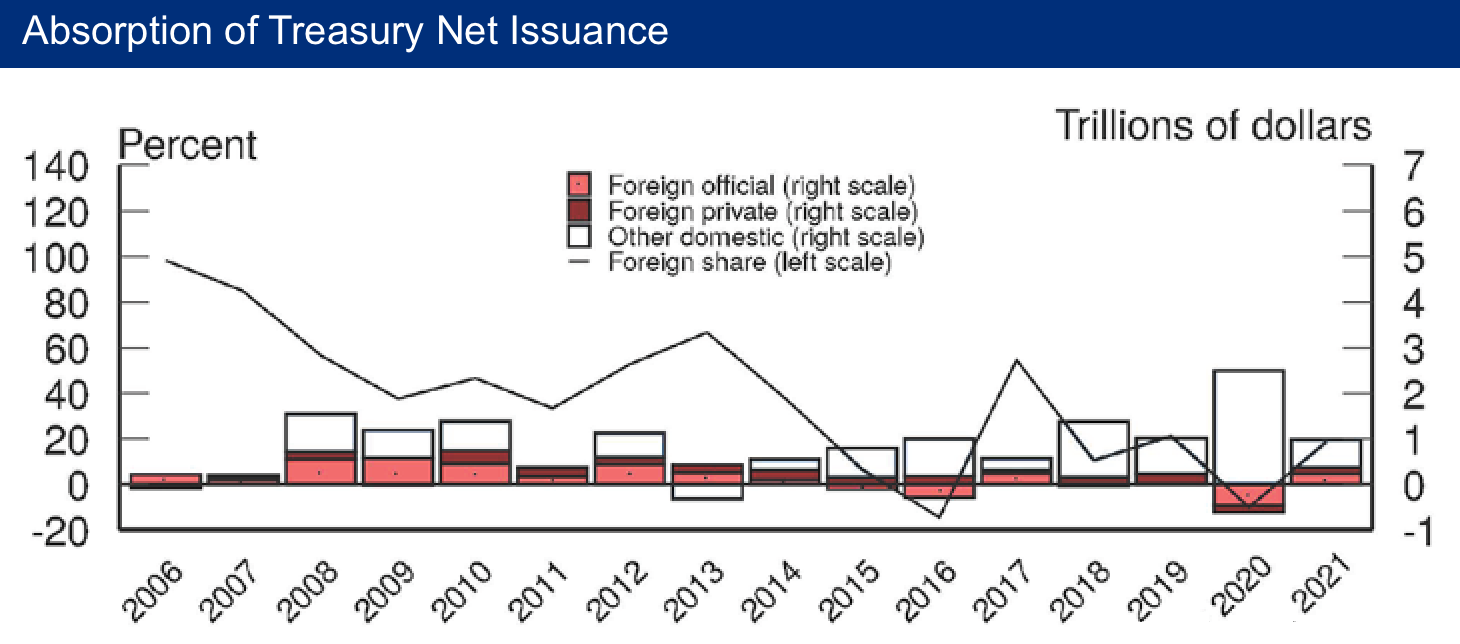
Figures 4/5 - Graphs depicting higher levels of foreign investors buying US treasuries during periods of financial stress. Source: FederalReserve.gov
One last supply/demand-related cause of the monumental DXY rally in 2022 has been simply due to the composition of the DXY currency basket. The largest currencies that comprise the DXY basket are the EUR, JPY and GBP respectively.
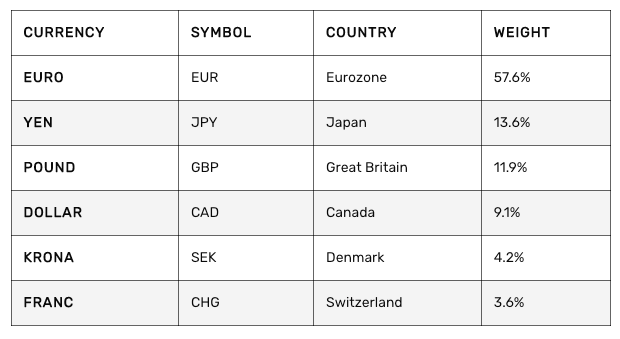
Figure 6 - The composition and breakdown of the DXY basket.
All of the aforementioned currencies have faced their own endo/exogenous threats of late, causing them to depreciate against the dollar in relative terms and thereby causing a dislocation in DXY strength.
EUR = Russia-Ukraine conflict and energy crisis.
JPY = BOJ/YCC stresses alongside continued mismanagement of monetary policy.
GBP = Poor handling of Brexit alongside the Truss/Kwarteng science experiment budget.
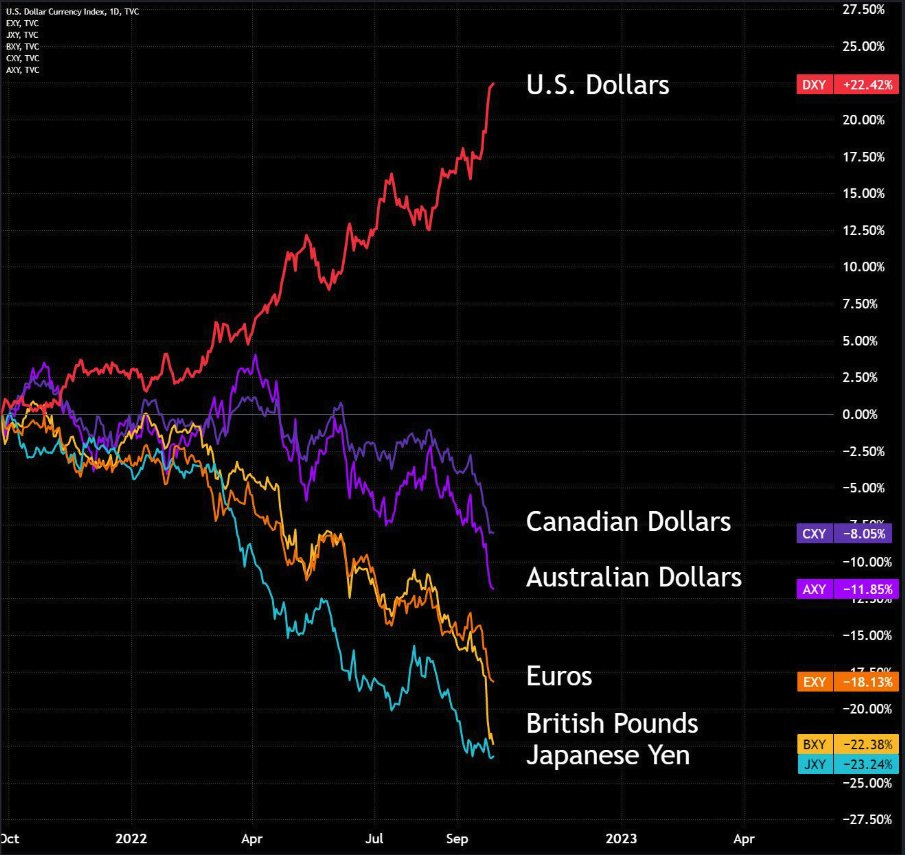
Figure 7 - Major global currencies visualised against the dollar during 2022. Source - TradingView
2. Market Sentiment
Thus far in 2022, US unemployment data has come in very low. If unemployment rates begin to rise and subsequent consumption slows, the US faces another leg down in bonds/stock markets as foreign investors attempt to return to local currencies from the USD, this will cause DXY weakness.
Recent job data on the 4th of November suggested that over 261,000 new jobs were added in the US economy - the labour market continues to remain strong in the face of rate hikes by the Fed, perhaps emboldening them to hike further in December and thus lending further strength to the DXY.
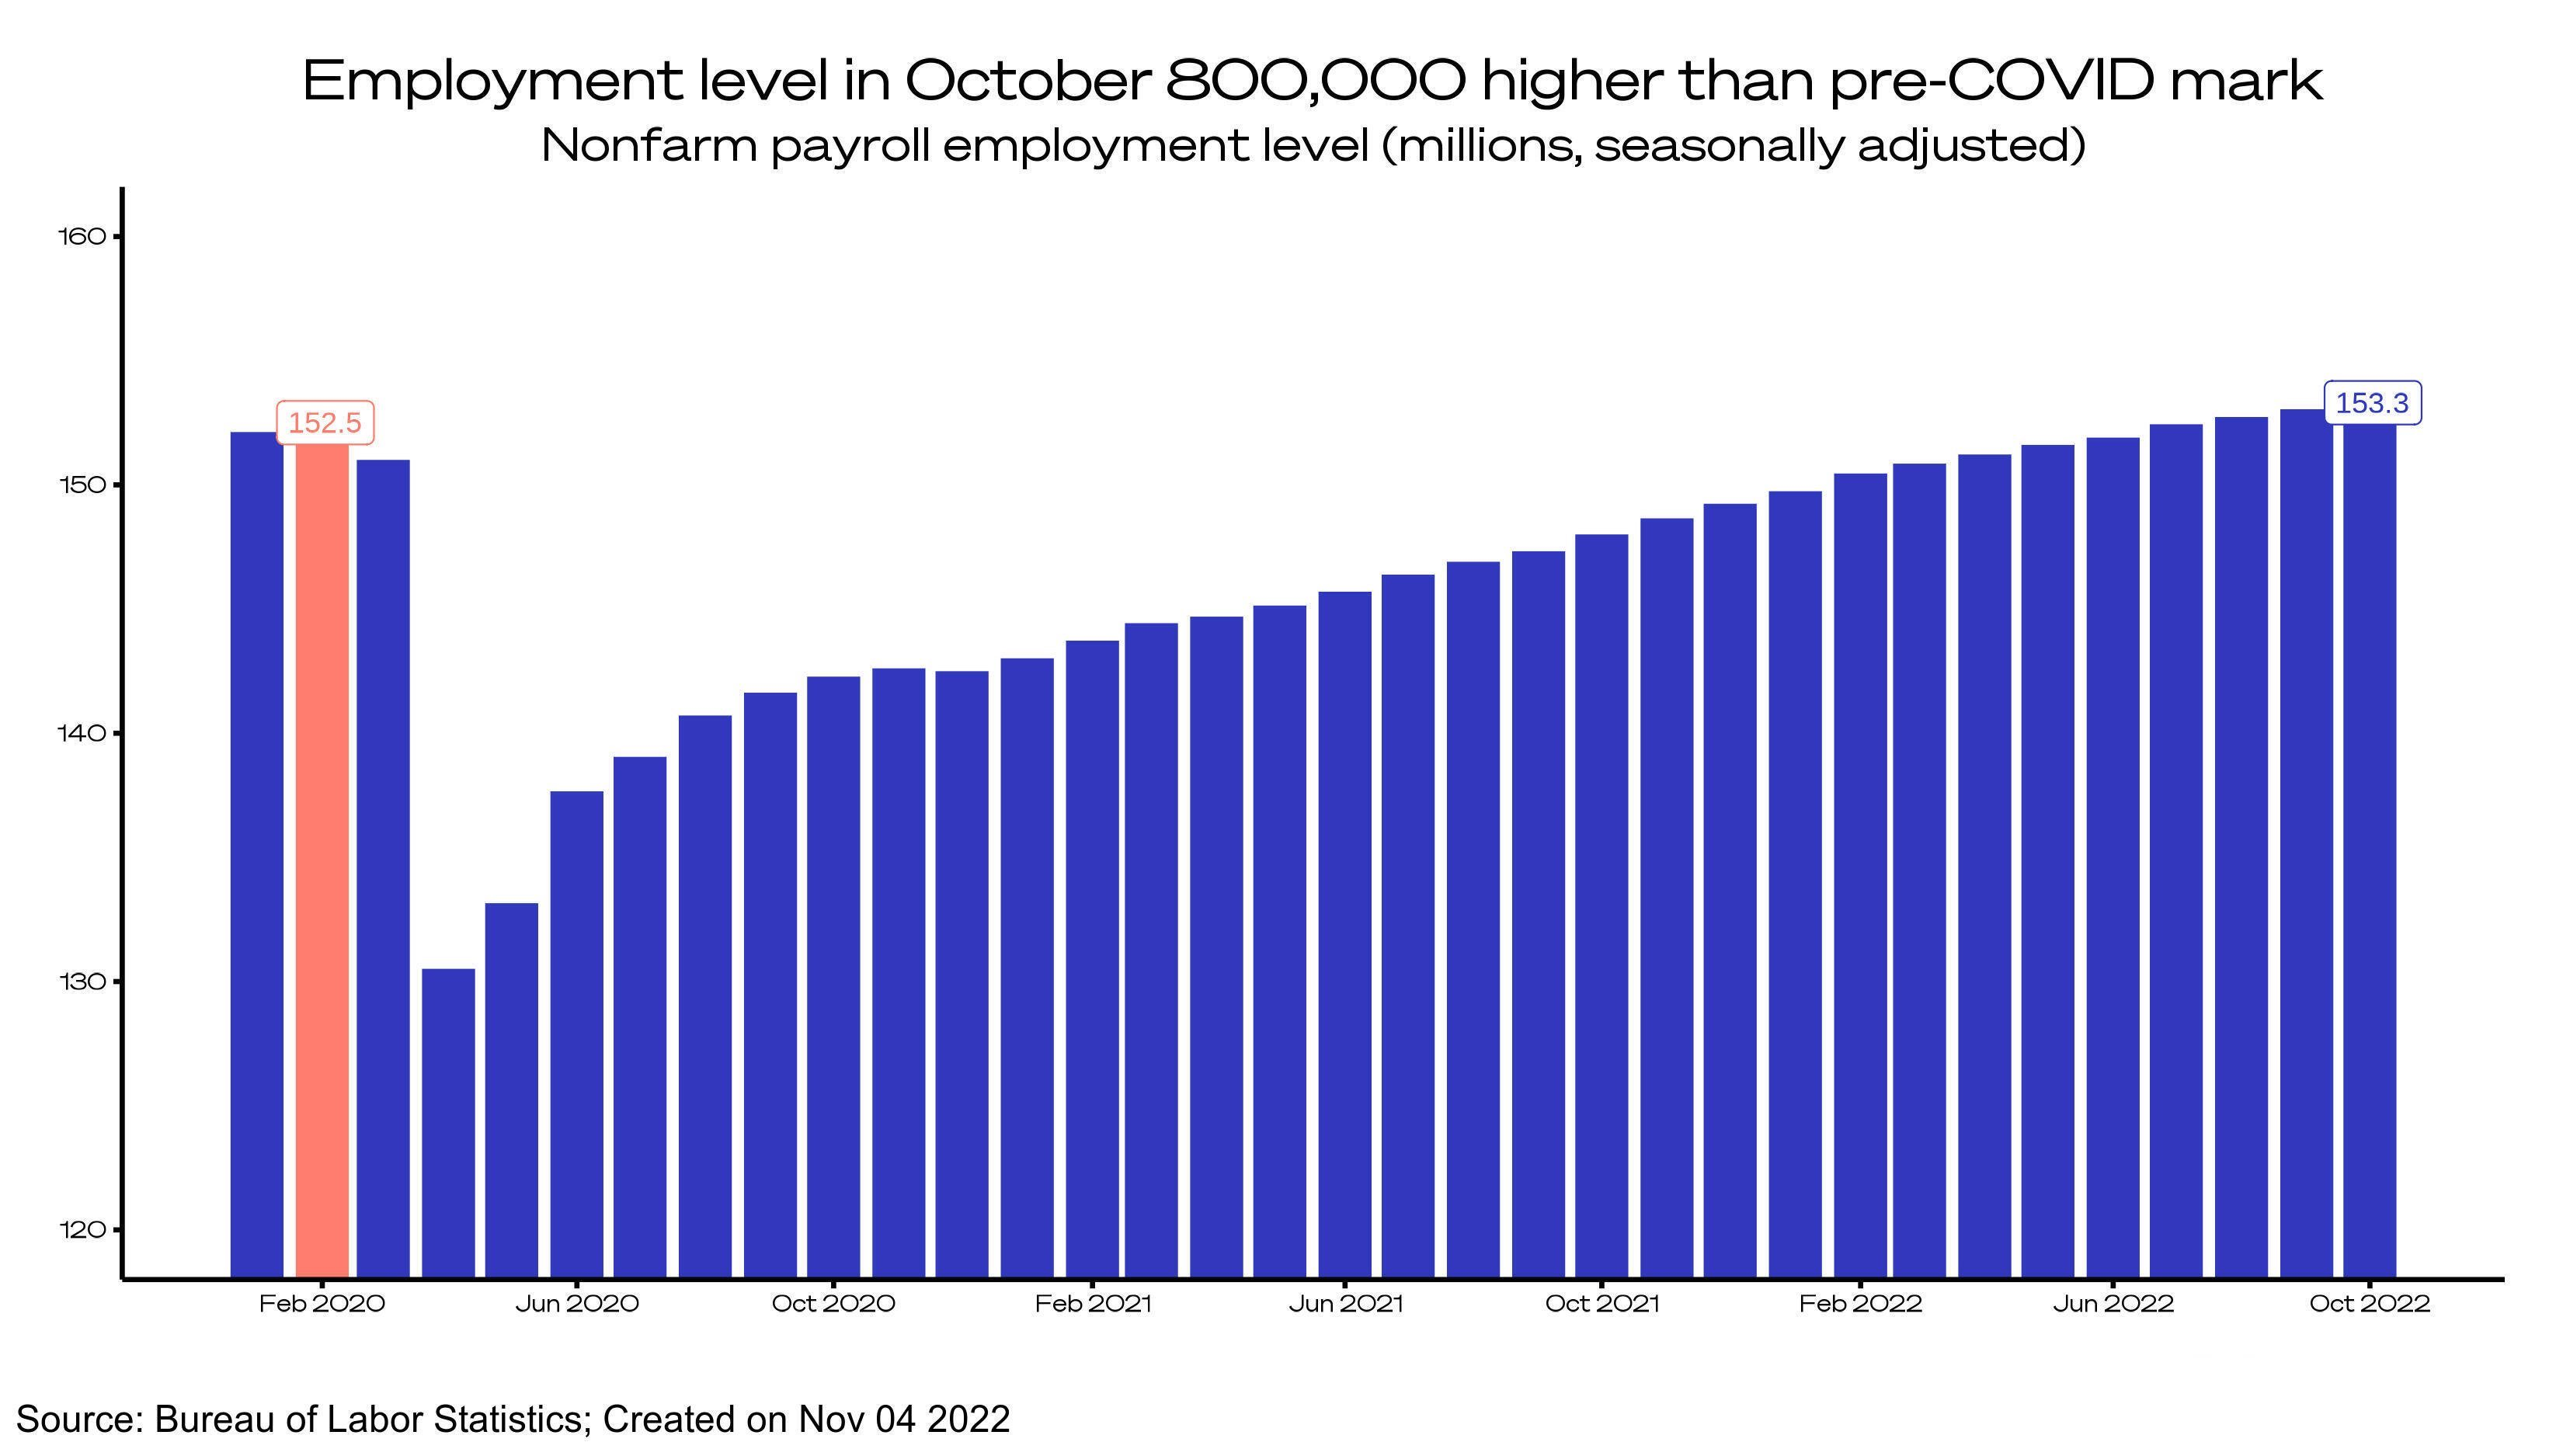
Figure 8 - US employment levels since 2020 lockdowns. Source - US Bureau of Labor Statistics.

Figure 9 - Current unemployment rates. Source - US Bureau of Labor Statistics.
Current unemployment rates aren't increasing by enough to conclude a trend at present. Most investors continue to remain relatively optimistic about global markets - the ‘buy-the-dip’ sentiment still remains strong. To even begin discussions of a pivot in policy, we need to see three consecutive monthly upticks in unemployment for statistical significance.
In recent weeks we have started to see this uptick in job cuts which is likely to be shown in the data soon and therefore priced into my forecast for a full Fed pivot around Q1 2023.
FedEx has just begun driver furloughs…when was the last time we saw cuts in the supply chain before the festive season?
Other notable Tech Layoffs: Meta - 11k (13%), Twitter - 3.7k (50%), Intel - 20%, Snap - 20%, Netflix - 450, Robinhood - 30%, Lyft - 13%, Salesforce - 2k, Amazon - 10k
120k+ layoffs in the past few weeks alone. The 2000-01 dot com bubble layoffs were around 107k. Q4 layoffs have just begun.
I track this data using - https://layoffs.fyi
3. Economic Data
Perhaps the most notable contributor to the strength in the DXY has been Fed hawkishness throughout 2022 with QT becoming increasingly severe.
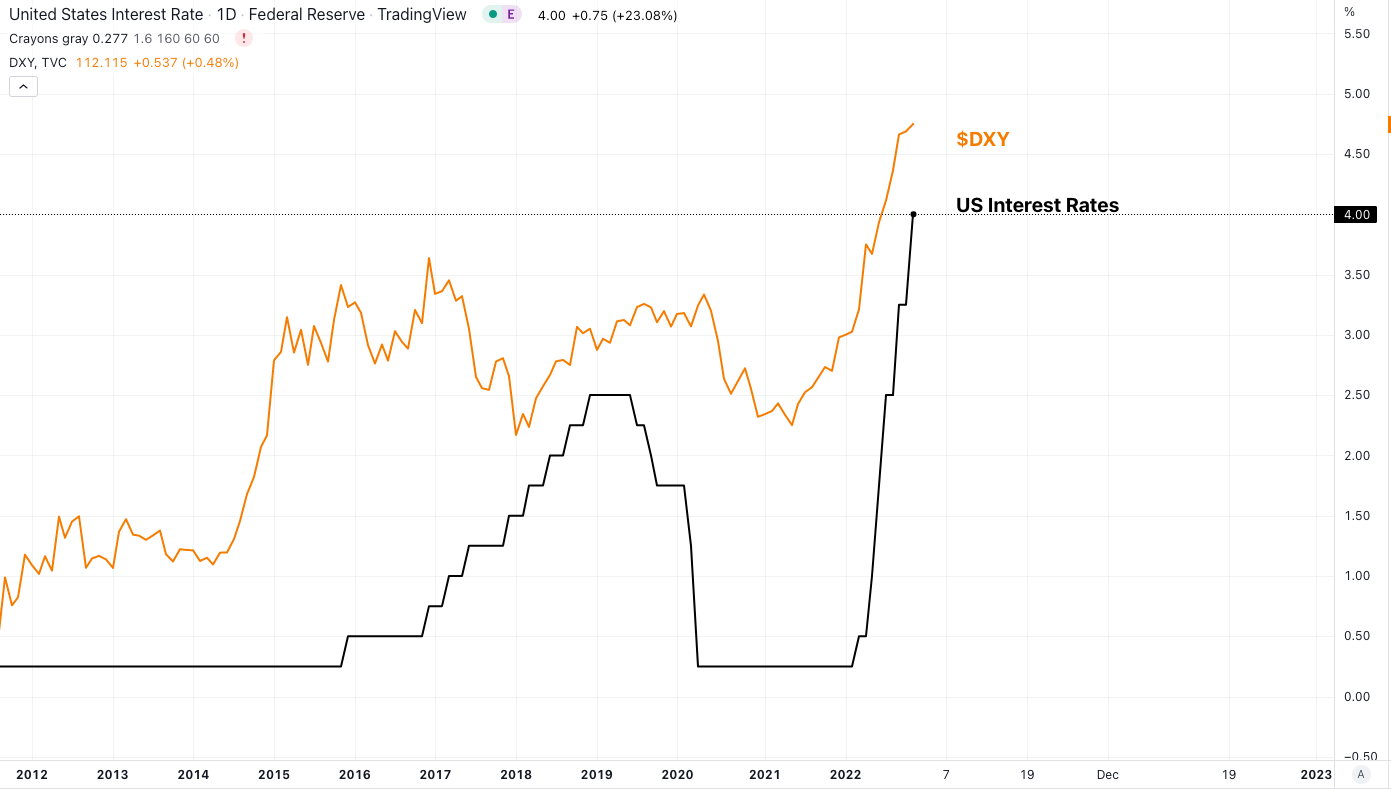
Figure 10 - Visualised DXY strength positively correlated with interest rate rises in the US. Source - TradingView.
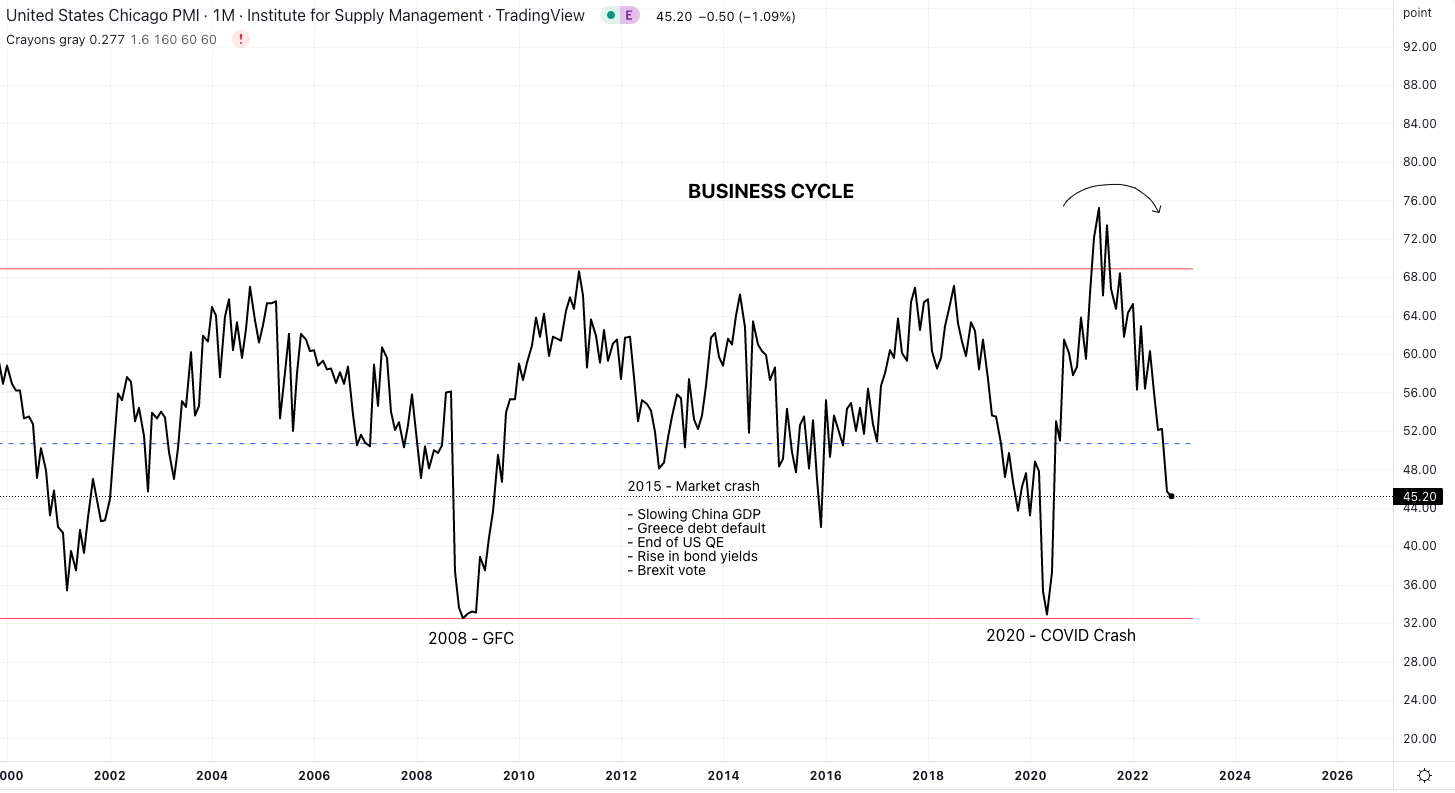
Figure 11 - The US business cycle as showcased by the Chicago PMI. Source - TradingView.
Liquidity
As mentioned in several previous articles - the most important indicator for Bitcoin is the USD liquidity conditions. This, combined with understanding the above dynamics of DXY strength, compounds to provide colour to both the canvas of the market and the wrecking ball.
Today, there are two key dynamics that impact USD liquidity in financial markets.
The total supply of dollars, or the total size of the Federal Reserve’s balance sheet.
The internal composition of the balance sheet - flows between the private financial markets, the Reverse Repo Facility (RRP) and the Treasury General Account (TGA).
A simplified breakdown of the Fed’s balance sheet can be found below.

Figure 12 - The Fed’s balance sheet dynamics. Source - The Last Bear Standing - Substack
The Fed expands its balance sheet with QE and shrinks it with QT.
Reverse Repo Facility - The RRP is a fixed-rate facility which enforces the Fed’s overnight interest rate target. Theoretically, if overnight rates in the private market are lower than the interest rate on the RRP, then the market participants will allocate more USD towards the RRP (thereby reducing private market liquidity). Conversely, if private interest rates are higher than the RRP rate, money should flow out of the RRP and back into private markets.
Treasury General Account - The TGA increases as the Treasury raises cash by issuing debt and decreases as government spending flows back into the private sector.
Financial Market Liquidity - Private markets are left with the remaining USD. The volume and velocity of which generally cause risk assets such as Bitcoin to rally.
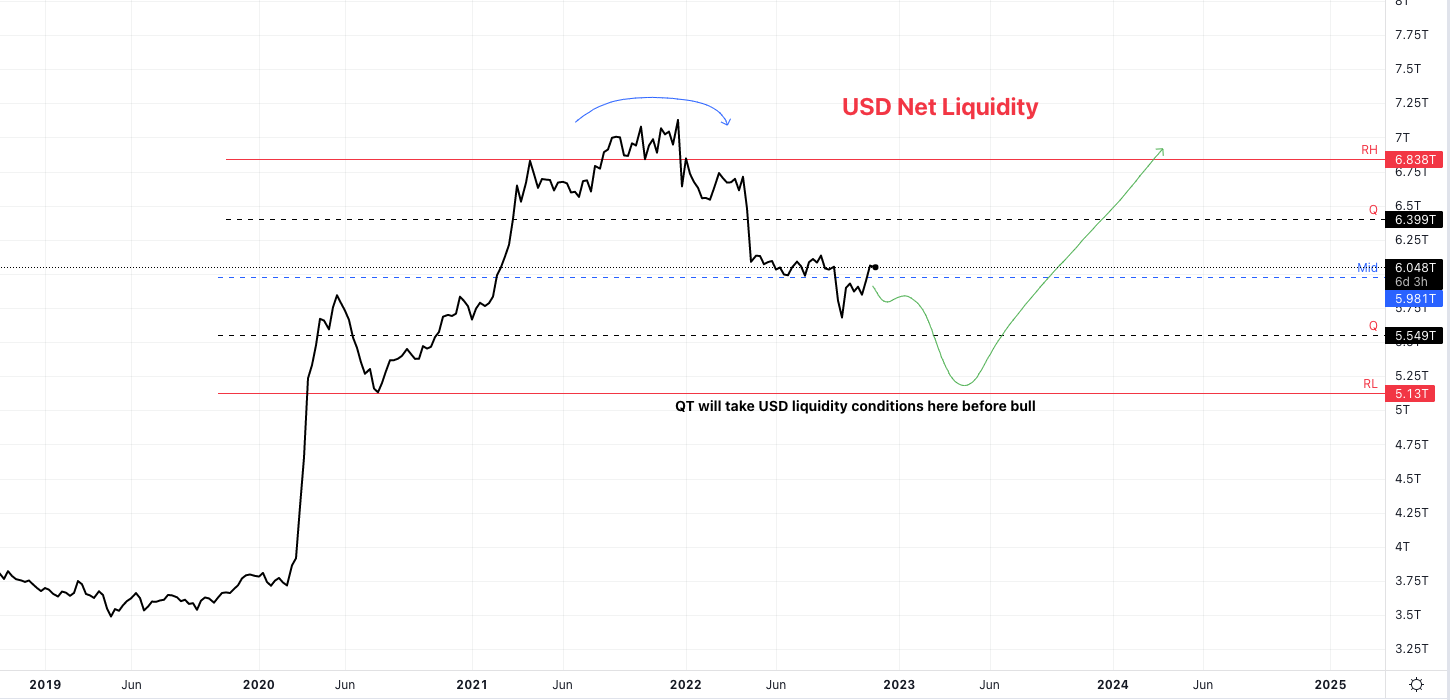
Figure 13 - Graphical representation of USD in the private market. Source - TradingView.
Total USD supply is easy to predict by the QE and QT schedules laid out by the Fed. However, changes in the internal composition are more complex and involve differing endo/exogenous variables and objectives. The dramatic decrease in private market liquidity over the past year has been driven primarily by these internal shifts, rather than the small reduction in aggregate supply due to QT.
Looking Forward
Calling a bottom in risk assets has historically been a game fraught with peril. Instead, I prefer to take a more holistic approach and gauge the relative risk-to-reward ratio (RR) of beginning to purchase within a specific price region within a specific timeframe.
That time is nearly upon us.
The major caveat to this is that I still maintain a neutral to bearish stance in both global markets and crypto - however, being cognisant of the fact that purchasing any liquid assets at 80%+ drawdowns will likely provide a much higher RR for my portfolio in the long term as risk begins to skew to the upside.
In order to confidently call a macro bottom, we must deeply analyse the Fed’s data and comments; therefore looking for a Fed policy pivot becomes more important than ever to ascertain when to reallocate, especially when viewed through the lens of USD liquidity.
A useful metric used to determine when a pivot may occur is the Fed terminal rate, this is used to establish the peak interest rate levels in the US. The rate is currently at 4%.
As discussed in previous articles, the bond market is vastly better capitalised and more intelligent than many other markets. The median forecast from over 30 bond strategists who answered a Reuters poll in early November put the terminal fed funds rate at 4.75%-5.00%, with one forecast as high as 5.50%-5.75%. The mean of the responses can be seen in the below graph.
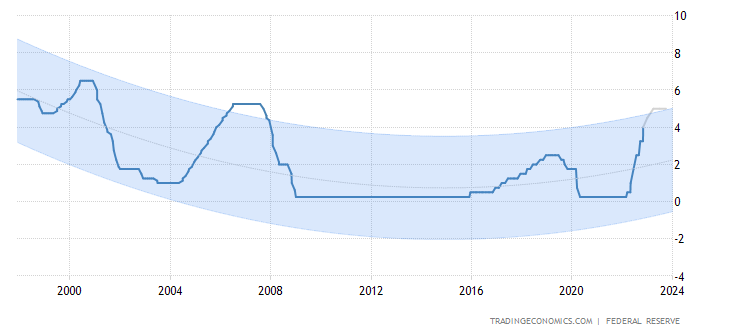
Figure 14 - Fed terminal rate projections. Source - Tradingeconomics.com
Next, we need to examine the Fed’s language and comments at the recent FOMC meeting in early November.
Transcript of Chair Powell’s Press Conference November 2, 2022
Powell was asked about a +50bps hike in Dec and he dodged saying “it’s about the pace, what level we get to, and how long we stay there.” But he left things open. He also left +75bps open and implicitly left 100bps open. The key here is he doesn’t know what they will be hiking by at the December meeting - this is a massive uncertainty in the context of the terminal interest rate as shown in Figure 11 above.
When the future becomes more uncertain in terms of the path, risk premia will go up. The current risk premia will rise to account for varied outcomes, hence my earlier alluded point of the RR investment in crypto becoming more favourable the lower we move in price.
Inflation is where it was a year ago. If he needs to raise rates to 8%, he will do it. He would rather break things and perform battlefield DIY because that is easier than letting problems become entrenched.
This was the most hawkish conference of the year. If you are still sitting in large positions in risk assets and equity markets at present, you’re juggling with multiple chainsaws.
Interestingly whilst researching price activity within markets immediately following a Fed pivot in policy, I found the following data:


Figure 15/16 - Data from previous Fed pivots alongside the property market reaction immediately following the action.
The above should not be taken as gospel. History is rarely repeated, but almost always rhymes in some way. It is always useful to maintain a complete awareness of the road ahead. Historically we have a few bumps left to overcome before clear skies.
Addendum
Recent events with FTX and the subsequent contagion with other large firms such as BlockFi, Genesis, Gemini and Luno are extremely worrying. Many large Tradfi firms saw FTX as a ‘low-risk’ foray into the digital asset arena and having likely lost most if not all capital invested will take a while to feel confident in the infrastructure of the market again.
From a digital asset standpoint - I strongly advise self-custody of assets whilst “the tide goes out and we see who has been swimming naked.”
I was around during the Mt. Gox era of Bitcoin in 2013, and I personally feel that this is a much more serious event. $8 Billion of funds lost from both retail and institutional investors alike just as Bitcoin and digital assets are achieving a more positive mainstream narrative in the wake of Ethereum’s new ESG proposition with the transition to PoS. Unfortunately, while USD liquidity conditions remain tight, whilst we remain in a QT regime and whilst we continually gift ammunition towards the anti-Bitcoin mainstream propaganda camp - we are unlikely to see a macro bottom in the digital asset markets.
I will publicly let everyone know when I’m transitioning into a bull, however, thus far in 2022 a healthy mix of scepticism and an awareness of wider macroeconomics has been extremely beneficial.