Have the Markets Bottomed?
Using inflation data to determine when to allocate back into risk assets
Disclaimer: Any views expressed in the below text are the personal views of the author/s and do not constitute investment advice or recommendations for investments. The author/s views should not form the basis for making investment decisions - invest in markets at your own risk after performing thorough due diligence.
The average market participant is more conscious of economic data than ever before, owing to the uncertainty and volatility we are seeing on a global level both financially and politically.
Due to the increasingly poignant impacts of new data releases from the US, as the Fed is now well underway in implementing its monetary tightening regime, the importance of understanding how to interpret the data and its implications for an investment portfolio has dramatically increased. Most actionable economic data comes out of the US, due to the global hegemony of the dollar.
In this article, we are going to delve into the mechanics of CPI and inflation data alongside how trading/investing with this in mind can have dramatic effects on your overall portfolio performance. Let’s dig in.
What Is Inflation?
In any economy, prices for goods and services fluctuate. Some prices rise, and some prices fall. Inflation occurs when there is a broad increase in the prices of goods and services, not just of individual items.
Long-lasting periods of high inflation are often the result of loose monetary policy. If the money supply grows too large relative to the size of an economy, the unit value of the currency diminishes, its purchasing power falls and prices rise. This is known as ‘monetary debasement’ - inflation through printing erodes the value of the currency over time. This relationship between the money supply and the size of the economy is one of the oldest hypotheses in economics.
Pressures on the supply or demand side of the economy can also be inflationary. Supply shocks that disrupt production such as the dramatic increase in oil prices following the Russian invasion of Ukraine, can reduce overall supply and lead to “cost-push” inflation, in which the impetus for price increases comes from a disruption to supply.
Conversely, demand shocks, such as an equity market rally, or growth policies, such as a central bank lowering interest rates to encourage spending, can temporarily boost overall demand and economic growth. If, however, this increase in demand exceeds an economy’s production capacity, the resulting strain on resources is reflected in “demand-pull” inflation. Policymakers must find the right balance between boosting demand and growth when needed without overstimulating the economy and causing inflation, it is a delicate balance that must be maintained.
Figure 1 - The main contributing forces to widespread inflation. Source - Investopedia.
Expectations are equally important in determining inflation. When consumers or businesses anticipate higher prices, they factor this into salary negotiations and contractual pricing adjustments (such as rent increases). This behaviour influences inflation in the subsequent data reads. When contracts are fulfilled and salaries or prices rise as stipulated, expectations become self-fulfilling.
CPI, Core and PPI - The Key Barometers
Measuring and quantifying inflation in an actionable manner is a contentious task with many seeking alternative methodologies for attaining an accurate read on broad price changes in an economy.
The Consumer Price Index (CPI) is one of the most popular measures of both inflation and deflation. The CPI measures the change in prices paid by US consumers. The Bureau of Labor Statistics (BLS) calculates the CPI as a weighted average of prices for a basket of thousands of goods and services which represent aggregate consumer spending.
Core Inflation (Core) is calculated by taking the CPI and subtracting the most volatile items such as food and energy. In this way, Core is always a smaller value than CPI. The controversy around the use of Core as an accurate inflation metric stems from the notion that rising food and energy prices are more likely to materially impact the household budgets of all consumers. Due to this, less importance is generally placed on Core readings. However, with the current global supply shocks, we are seeing with energy and food, the Core readings have carried more importance in recent months, acting as a less noisy CPI.
Another metric for measuring inflation is the Producer Price Index (PPI), which measures changes in the prices received by US producers of goods and services. This is a measure of wholesale inflation as opposed to consumer inflation and is used in conjunction with CPI to get an accurate read on the wider economy.
In essence, if these gauges of inflation are rising too dramatically from a MoM % perspective, then inflation is out of control and the Fed must step in to prevent a catastrophic price spiral causing average consumers to suffer.
The dominant tools in the Fed’s arsenal for combating rising inflation are raising interest rates and reducing the size of their balance sheet by selling US Treasuries and Mortgage-Backed Securities (MBS) - this is known as quantitative tightening (QT) and is the inverse of Quantitative Easing (QE - money printing). Both interest rate rises and QT ultimately result in less availability of capital (M2) and liquidity in the financial system.
Interest Rates - The Important Lever
An interest rate is a measure of the cost of borrowing. If you’re a borrower, the interest rate is the amount you are charged for borrowing money, shown as a percentage of the total amount of the loan. The higher the percentage, the more you have to pay back, for a loan of a given size.
A small change in interest rates can have a large downstream impact on both consumers' and businesses’ ability to borrow capital. By raising interest rates, a central bank reduces the quantity of borrowing in the economy, and the availability of capital, thereby slowing economic growth alongside many of the contributing hallmarks of inflation. As a direct result of this, financial markets take a battering in the face of rising interest rates as the price of money increases. This is the cause of the carnage we have seen thus far in 2022, especially for risk assets such as $BTC.
Figure 2 - A chart showing the relationship between $SPX and $BTC with the US CPI data. Annotated with key dates and data. Source - TradingView
Simply the mention of interest rate rises by the Fed in Q4 2021 signals the market top for risk assets and equities even before interest rates were raised on March 17th 2022.
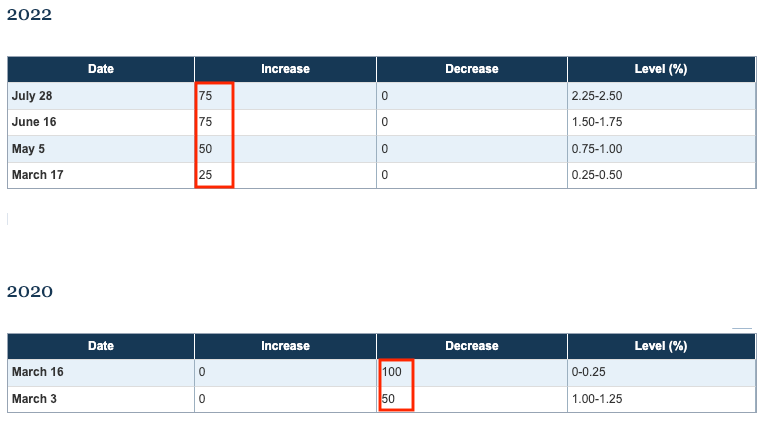
Figure 3 - Interest rate increases and decreases MoM by the Fed over the last several years. Source - TradingEconomics
In Figure 3 we can see how lowering interest rates and easing monetary policy to accommodate for lock-downs, stalled economies and COVID in March 2020 caused all markets to rally due to more availability of capital (M2). However, the inverse is seen in 2022 as the Fed began to hike rates in the face of increasing inflation.
Correlations And Relationships
The delicate dance of CPI, Core inflation and PPI when put into a graphical format is eye-opening and we can see how in all previous economic contractions or recessions, we have entered with high readings on all these inflation metrics. The cause of these contractions is usually the Fed choosing to tackle increasing inflationary forces by raising interest rates.
Figure 4 - High time-frame view since 1950 of the relationship between CPI and Core inflation relative to the grey shaded periods of recession and economic contractions. Source - FRED
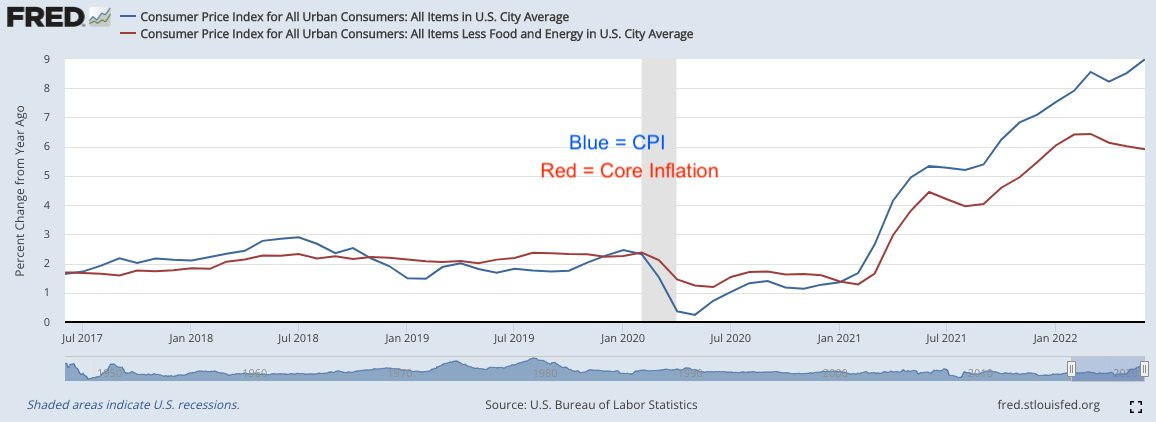
Figure 5 - Low time-frame view since 2017 of the relationship between CPI and Core inflation. Source - FRED
Note how in the above more recent relationship between CPI and Core the divergence between the two readings. This shows the increasing importance of energy in controlling inflation and plays into our narrative of the importance of NATO’s response to the Russia/Ukraine war. We wrote about this in a separate article and it is a key factor in us not yet believing that we have reached ‘peak inflation’.
Figure 6 - Low time-frame PPI since 2008. PPI reading entered 2008 at a high level and then interest rate cuts lowered the data reading. Source - FRED
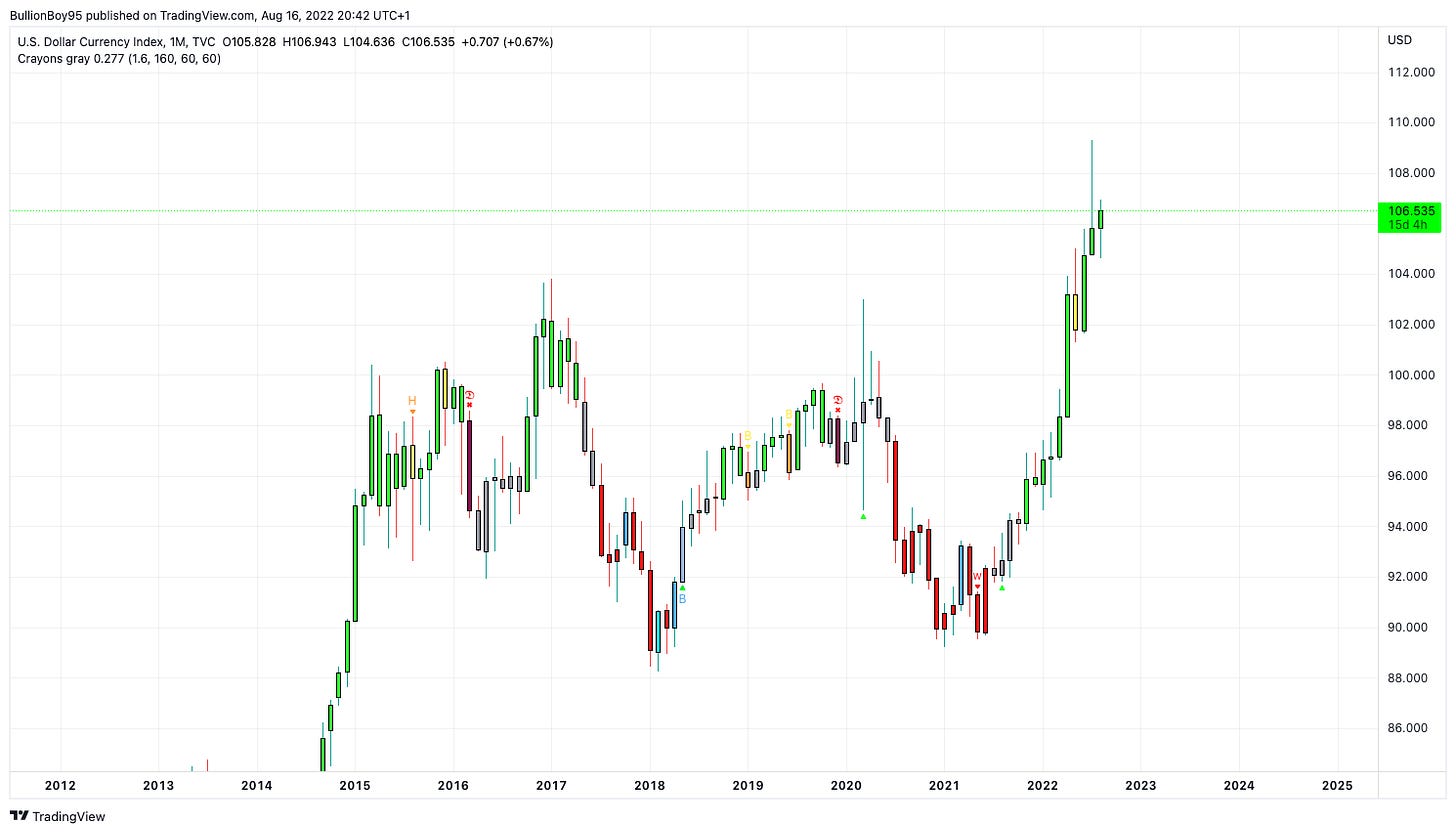
A rising interest rate also strengthens the dollar as there is more demand for cash. This is where the age-old adage is derived from - “cash is king”.
Figure 7 - The $DXY dollar index has risen sharply in 2022 since interest rates have been rising. Source - TradingView
Whilst interest rates have risen in recent months, the dollar index has been an absolute wrecking ball for developing economies. This has put further downward pressure on the price valuations of crypto, risk assets and equities as many of them are dollar-denominated.
Figure 8 - CPI overlayed with interest rate fluctuations. Blue = Interest rates. Black = CPI. Red boxes show periods of rising interest rates to combat inflation. Source - TradingView
Figure 8 represents the relationship between inflation and CPI - since 1972, the two economic forces have moved in near perfect tandem with interest rates slightly lagging the inflationary data output. Major market bottoms and generational buying opportunities present themselves when the inflationary data begins to reach its peak and interest rates are then lowered as a direct policy reaction. This is where we want to be buying.
When Will Markets Bottom?
On August 10th - inflation data was below expected and signalled the potential that we had reached ‘peak inflation’, a potential Fed pivot in policy (reducing interest rate rises) and that markets could start to resume their movements upwards following a disastrous start to the year.
The markets and all risk assets subsequently rallied a healthy amount, but have now once again stalled at key resistance levels, thereby maintaining their bearish macro market structures.
Figure 9 - The MoM % change in CPI. Source - BLS.gov
The above % change chart of CPI is misleading and is the data that Biden referenced in his now infamous address where many thought he was simply “doing a Joe” and forgetting where he was again. In fact, the % growth of CPI in July was at 0%.
8.5% inflation remains a very worrying figure and is a long way off the Fed’s 2% inflation goal. Various Fed speakers have since signalled their continued concern about the data. Fed’s C. Evans said on the 11th that “inflation is still unacceptably high and the Fed will continue to hike rates through this year and into 2023.” Evans is normally one of the most dovish (accommodative) of the current Fed - so this is a strong statement. N. Kashkari also gave comments of a similar nature. Therefore any hopes of a wider market reversal and a return to the bull market euphoria we all love and miss so very deeply were stopped dead in their tracks.
The Fed is looking to battle inflation further and we expect 75-100bps interest rate rises at the September FOMC meeting regardless of potentially slightly lower CPI prints in the runup. Even if prints are lower, it will not be by a significant enough margin for a wider policy pivot. As we enter winter and energy supply shocks alongside the Russian war continuing in the East, we will likely see a sharp uptick in the components of CPI.
We believe the market to be wrong in the short term.
What we have seen in July/August thus far is a ‘reversion-to-mean’ rally. The short trade was overcrowded.
Figure 10 - The ratio of global exports to output. Source - BCA Research
Furthermore, with all of the geopolitical turmoil in the world at present - China and India performing military exercises with Russia, Nancy Pelosi visiting Taiwan, China sanctioning Taiwan and becoming increasingly aggressive, US/EU involvement in Ukraine, Russian sanctions and US military exercises in South Korea; we seem to have stagnated from a globalisation import/export perspective. As Figure 10 above shows, we are in a dramatic downward trend with global trade. This adds yet further confluence to the argument that we have not yet seen the elusive ‘peak inflation’.
Markets must manufacture further liquidity and draw in more participants to signal the next leg lower. Alas, from a psychological perspective, markets looking healthier going into the September FOMC meeting on the 21st will be another incentive for the Fed to get more aggressive with interest rate hikes, they will be emboldened by the fact that current hikes haven’t turned the economy into a corpse.
We as humans are inefficient and rarely fix our mistakes, often repeating them. However, the market is one of the most efficient and precise tools ever created. It will correct its current mistake and lead the euphoric participants of recent months into becoming exit liquidity for those that are capable of reading and disseminating economic data.
If the central bankers really cared about fighting inflation, they would immediately raise the interest rates to match inflation levels. Imagine if the Fed raised rates to 8.5% (latest CPI print). It likely would stop many components of inflation in their tracks, albeit at the expense of asset holders and the ruling class. If the Fed is really prepared to do the unspeakable to fight inflation, then they should do it.
But they won’t.
The Fed can justify ending its tightening cycle by pointing to a looming economic recession in the US which is now being increasingly hinted at. If the Fed can credibly claim that inflation has peaked and the inflation rate slows enough that, even if prices continue to rise, they can say the we are past the worst – then they can switch to recession prevention without causing too much distress to the public. ‘Recession prevention’ likely involves some sort of QE dressed under another name. The only way the Fed knows how to prevent a recession is to loosen monetary policy by turning on the printing press and cutting interest rates. This is good for risk assets.
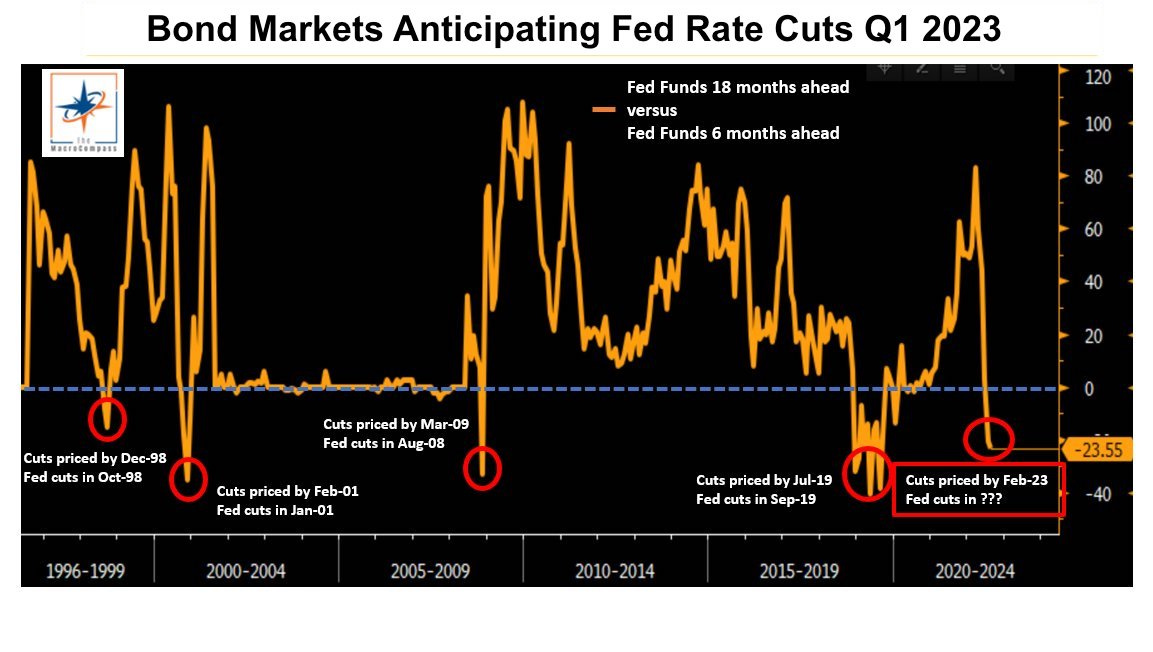
Figure 11 - Bond markets are pricing in Fed rate cuts in February 2023. Source - The Macro Compass
The bond markets have an inverse correlation with interest rates. They are currently pricing in interest rate cuts in Q1 2023 - this is important and adds further confluence to our hypothesised timeframe for a market bottom in late Q4 2022 - Q1 2023.
For risk assets such as $BTC, we should primarily be concerned about the dollar liquidity conditions’ rate of change and the quantity of money. The Fed’s focus revolves around the price of money through interest rates.
Figure 12 - M2 monetary expansion overlayed with the price of $BTC. Source - TradingView
Figure 13 - A poignant display of the relationship between M2 in circulation (Blue) and rising CPI/Core inflation (Purple/Green). Source - FRED
Crypto responds positively to an increase in the quantity of dollars in circulation (M2). The quantity of Bitcoin is fixed at 21M, therefore when the dollar denominator grows Bitcoin’s relative value increases. Simply the expectation of an increase in the quantity of dollars (M2) through QE and interest rate cuts in 2023 will likely spur prices of cryptos and risk assets significantly higher. This is why a Fed pivot in policy is extremely important to signal when we can allocate again.
Of course, we may be completely wrong. We may have already seen ‘peak inflation’ and naturally the largest of the interest rate hikes at 75bps, alongside a Fed beginning to pivot in July. However, given the plethora of both geopolitical and economic evidence we have presented briefly above, we do not believe this to be the case.
Summary
Inflation is a measure of the debasement of currency and purchasing power per unit - it is measured in CPI, Core inflation and PPI.
Interest rate levels dictate the monetary velocity and availability of capital in an economy whilst being the main tool that policymakers have in controlling inflation rates.
All markets topped in Q4 2021 due to the Fed signalling QT and interest rate rises in a bid to control rising inflation since the wanton money printing following COVID in 2020.
Major market bottoms are formed when inflation ‘peaks’ and interest rates begin to decline - this is what we want to target for the generational buys.
We believe that markets have another leg lower into Q4 and that when there is a meaningful reason for the Fed to pivot and start decreasing interest rates - we can begin to assume that markets have bottomed and begin to allocate investment capital into risk assets.

