

Macroeconomics - My Investment Stack
Macroeconomics - My Investment Stack
Navigating the Complicated World of Macroeconomics to Obtain Actionable Investment Data.


Disclaimer: Any views expressed in the below text are the personal views of the author/s and do not constitute investment advice or recommendations for investments. The author/s views should not form the basis for making investment decisions - invest in markets at your own risk after performing thorough due diligence.
It has been a while.
I last posted here back in November 2022.
Positive feedback and growing demand from my Twitter audience have prompted me to revive the ancient art of long-form writing to more clearly and comprehensively share my thoughts and views of the financial world to which we are beholden.
I have recently observed a huge uptick in demand and interest for actionable macroeconomic education, yet most on Twitter either post high-level, specialised jargon which is otherwise unusable for most readers or simply lack any knowledge at all and try to ChatGPT their way through a thread with some clumsy prompts from Bloomberg articles or the FT.
In this post, I’ll dive into the key macroeconomic datasets and indicators that I follow. Using data and understanding the basic interrelationships and downstream effects in the economy greatly aids an investor's ability to be able to confidently allocate funds at the correct time.
As an investor, your main responsibility (even above managing risk) is to be as informed as possible about the wider financial environment before pressing the green button.
Summary
Real GDP ↑ = Asset prices ↑
Corporate Earnings ↑ = Asset prices ↑
Consumer Spending (PCE) ↑ = Asset prices ↑
Monetary Policy (Tigher) = Asset prices ↓
Interest Rates ↑ = Asset prices ↓
Credit/Liquidity ↑ = Asset prices ↑
Inflation ↑ = Asset prices ↓ (Time lag)
Unemployment Rates ↑ = Asset prices ↓
Housing Markets ↑ = Asset prices ↑
Geopolitical Events (Severity) ↑ = Asset prices ↓
The Indicators
1. Gross Domestic Product (GDP)
Gross Domestic Product (GDP) - The lifeblood of a nation's economic prowess and a key barometer of its prosperity. It encapsulates the entirety of a country's economic activity and growth by aggregating the monetary value of all goods and services produced within its borders over a specific period of time. For those venturing into the realm of macroeconomics, understanding GDP is akin to acquiring a compass for navigating the financial landscape.
A robust GDP is often heralded as the harbinger of a flourishing economy, with ripple effects that permeate various sectors. This vital indicator signals the creation of more jobs, fostering increased consumer spending and, in turn, bolstering the revenue streams of companies. Consequently, asset prices often soar in response to a thriving GDP, as investors' confidence in the economy surges.
However, we must delve deeper to discern the true nature of economic growth.
Enter Real GDP – a more refined and precise measure that adjusts Nominal GDP for inflation. By eliminating the distorting effects of inflation, Real GDP reveals the actual growth of production, providing a clearer and more accurate picture of an economy's health. This distinction is crucial for those seeking to make informed decisions in the financial sphere, as it allows for a better understanding of economic trends and their implications for investments.
I prefer to use Real GDP instead of many traders/investors that solely look at nominal readings.
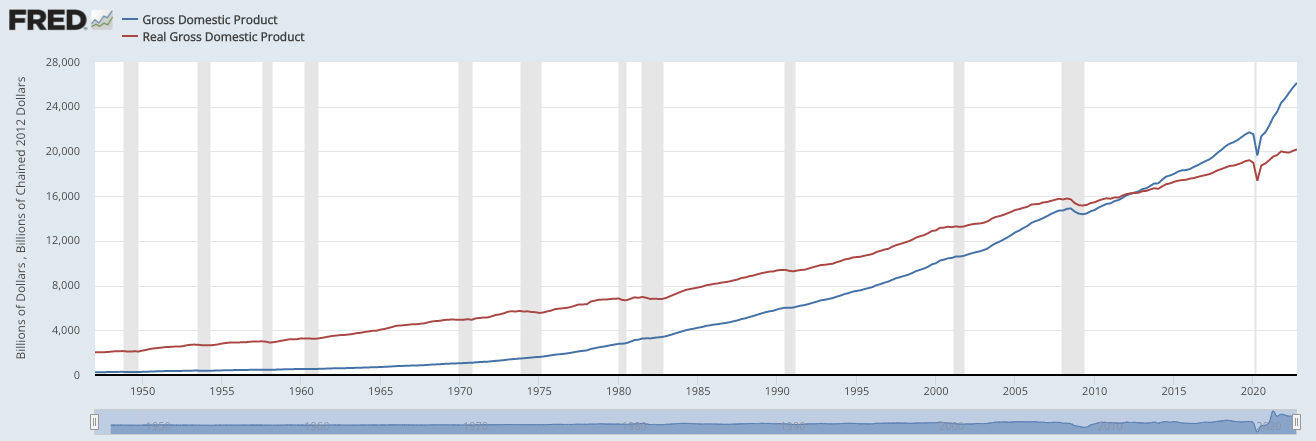
Figure 1 - US nominal GDP vs Real GDP. Source - U.S. Bureau of Economic Analysis
To expand on the above and make the dataset more actionable, we can adjust to show YoY % change of nominal GDP vs. YoY % change of Real GDP as below - this gives much clearer readings.
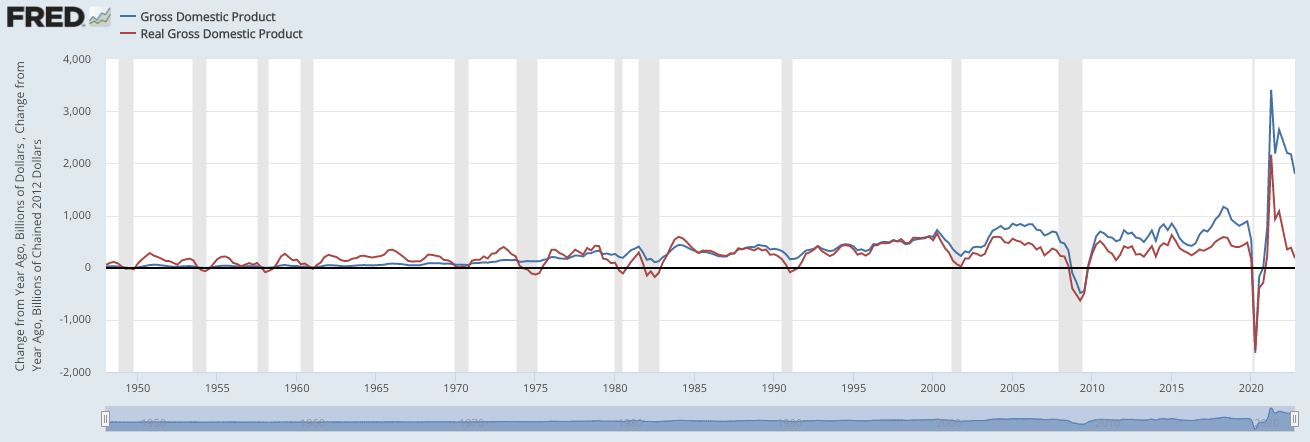
Figure 2 - US nominal GDP vs Real GDP. Source - U.S. Bureau of Economic Analysis
2. Corporate Earnings
Robust corporate earnings weave a tale of thriving businesses, heralding profitability and the promise of increased revenue generation in the future. This performance resonates with investors, coaxing them to gravitate towards flourishing companies, thereby driving up asset prices in anticipation of bountiful returns.
Conversely, when the chords of weak corporate earnings reverberate through the financial sphere, a sombre tune emerges, painting a portrait of businesses struggling to stay afloat in a sea of dwindling profitability. This discordance sends tremors of caution rippling through the investment landscape, prompting a decline in asset prices as the spectre of uncertain revenue looms ominously on the horizon.
To access this crucial information, investors can turn to individual company websites or rely on reputable financial data providers such as S&P Global Market Intelligence, FactSet, and Thomson Reuters.

Figure 3 - Quarterly retained earnings of US corporations. Source - U.S. Bureau of Economic Analysis
3. Consumer Spending (PCE)
Consumer Spending (PCE) - A vital gauge of the flow of money as consumers purchase goods and services. This economic indicator reflects the financial pulse of an economy, revealing the propensity of consumers to spend and the consequent impact on businesses.
When consumer spending is high, it leads to an increase in asset prices, as it illustrates a robust economy with consumers possessing the means to purchase more. This, in turn, translates to higher revenue for companies, further invigorating the economy. Governments typically release consumer spending data on a monthly basis, offering valuable insights for investors and policymakers alike.
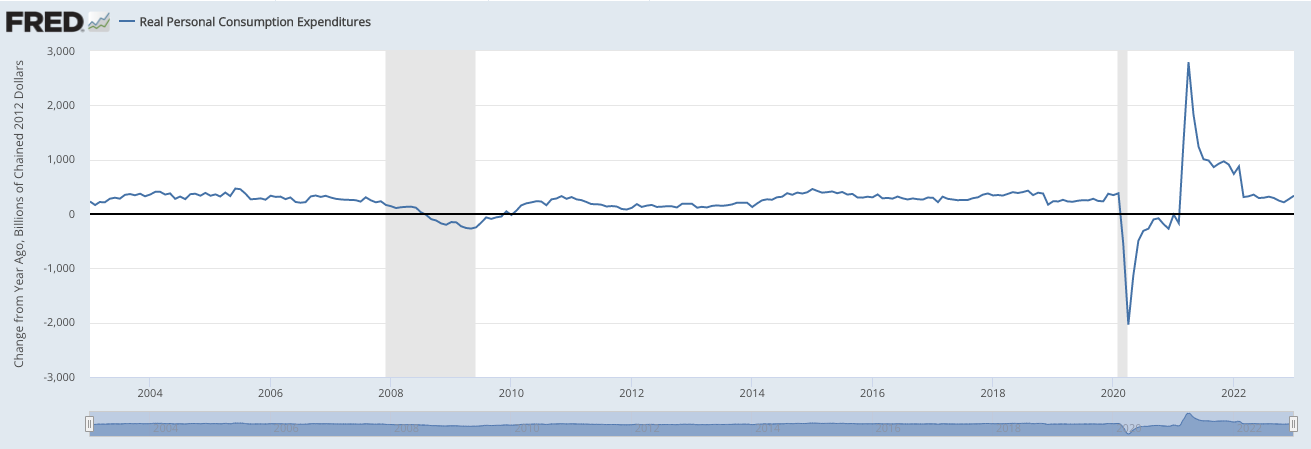
Figure 4 - PCE Change YoY. Source - U.S. Bureau of Economic Analysis.
In addition to PCE, I like to use the Consumer Confidence Index (CCI) as another tool to assess consumer sentiment. This data can be accessed through the website of the Bureau of Economic Analysis (BEA) in the United States or the National Bureau of Statistics (NBS) in most countries or with the ticker USCCI on TradingView.
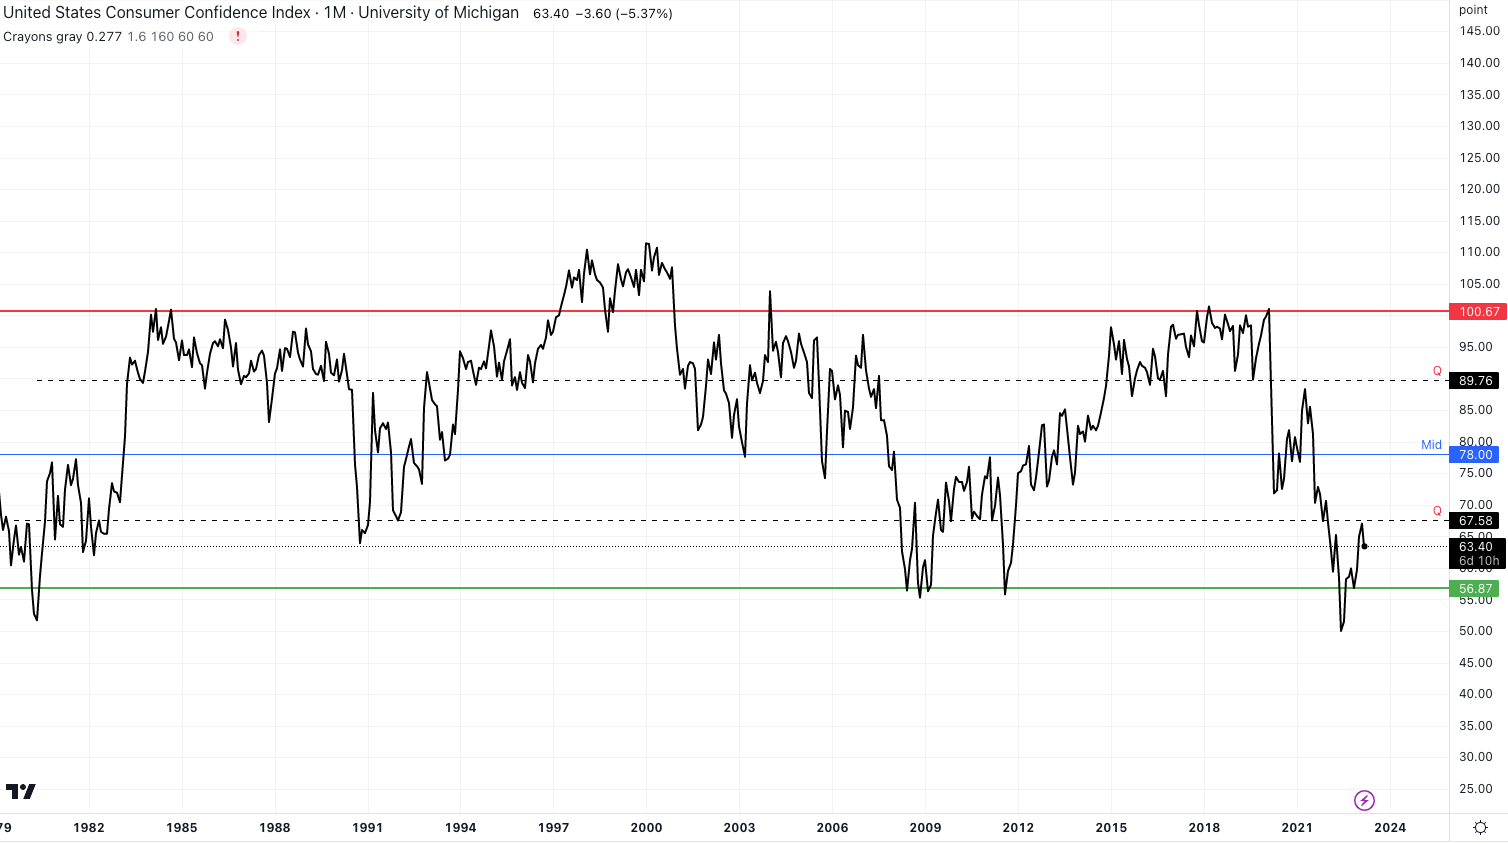
Figure 5 - US CCI since 1962. Source - TradingView
Both the Personal Consumption Expenditures (PCE) and the Consumer Price Index (CPI) serve as determinants of consumer spending. However, PCE is preferred by many due to its inclusion of a broader range of goods and services. In contrast, the CPI primarily focuses on measuring the change in the prices of goods and services, serving as an inflation proxy.
I wrote about the interrelationship between CPI, CCI and unemployment rates in the below thread on Twitter back in mid-2022 and also here in one of my previous posts.


4. Monetary Policy
The intricate tapestry of actions orchestrated by central banks to meticulously regulate the supply of money and modulate interest rates.
Central banks wield an arsenal of monetary policy instruments, such as quantitative easing (QE), open market operations, and interest rate adjustments, to influence the economic landscape. These levers of power hold sway over the availability of credit and the cost of borrowing, thereby leaving an indelible mark on asset prices.
In an era of tight monetary policy, as exemplified in 2022, asset prices tend to experience a downturn. The financial landscape becomes more arduous, as borrowing money and investing become increasingly expensive. Conversely, during times of loose monetary policy, such as the scenario witnessed in 2020 with rampant QE following the outbreak of C19, asset prices often ascend, buoyed by the allure of cheaper borrowing and enticing investment opportunities.
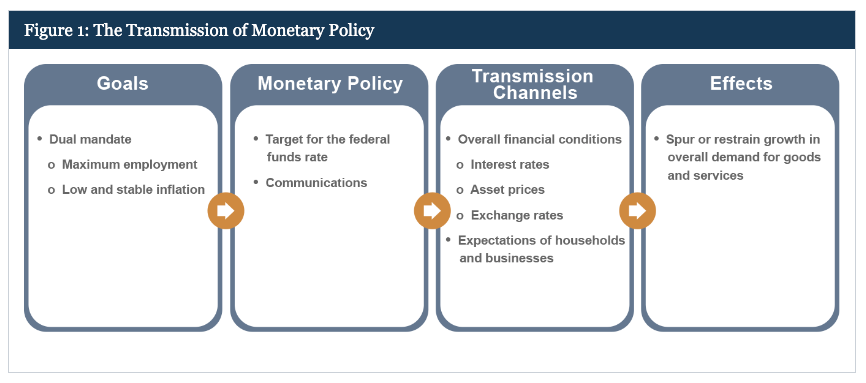
Figure 6 - The Transmission of monetary policy. Source - www.ECB.europa.eu
5. Interest Rates
Interest Rates - The cost of borrowing money.
Meticulously determined by central banks, interest rates function as a pivotal mechanism to modulate inflation within an economy. When rates climb, asset prices often experience a downturn, as the burden of borrowing intensifies, impeding companies' abilities to invest and expand their operations.
Central banks periodically unveil interest rate data, providing crucial insights to investors and policymakers navigating the financial landscape.
To obtain this invaluable information, one can search the websites of the Federal Reserve in the United States, the European Central Bank in the European Union, or the Bank of Japan in Japan.
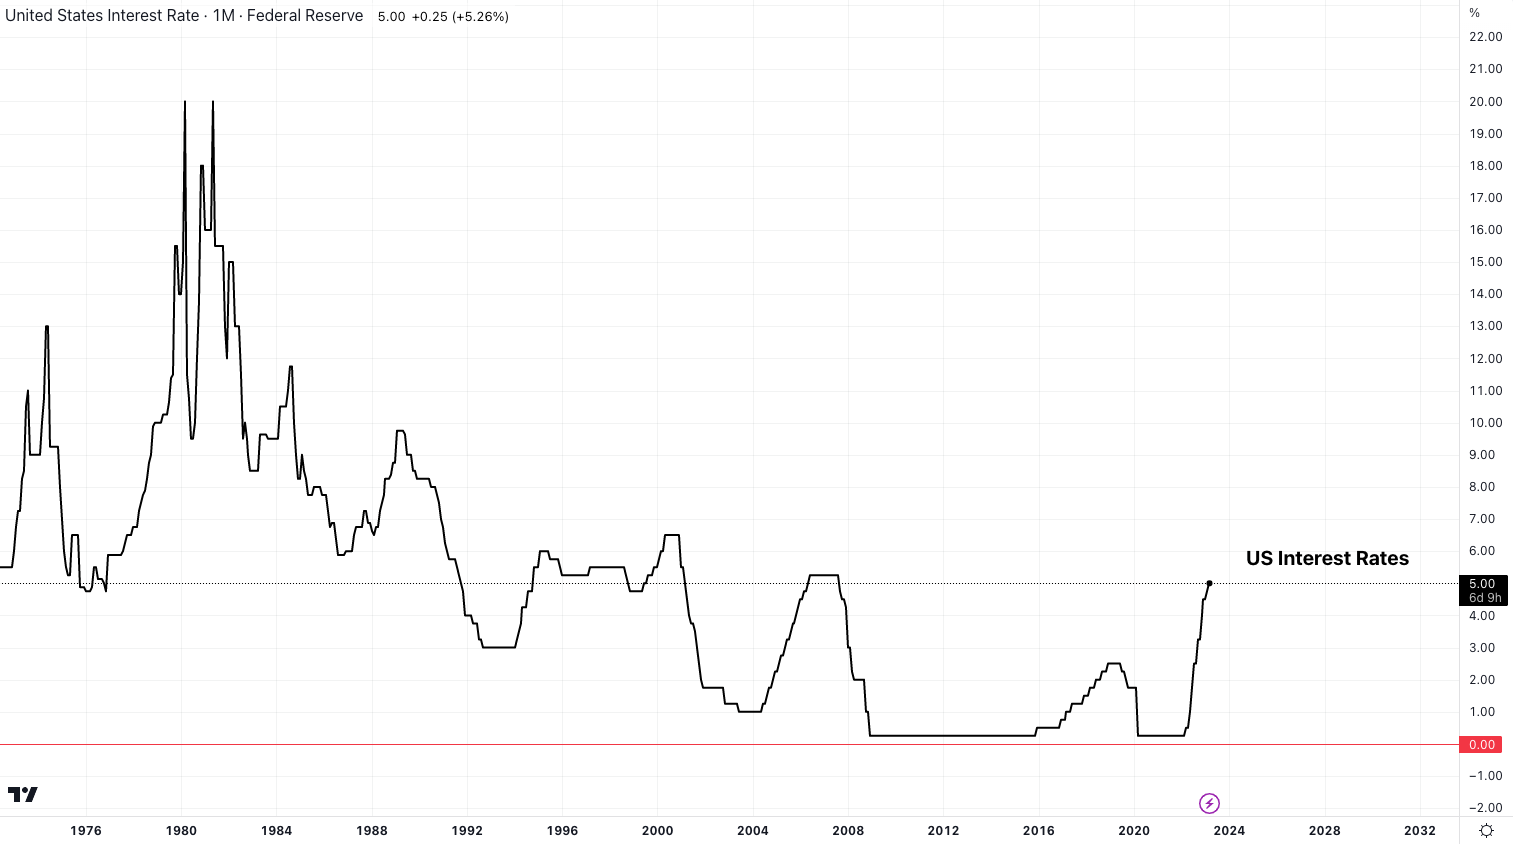
Figure 7 - US interest rates since 1976. Source - TradingView
6. Credit and Liquidity
When these measures soar, asset prices often follow suit, reflecting an abundance of capital for companies to tap into. This excess liquidity enables businesses to borrow, invest, and expand their operations, consequently generating higher revenues.
Conversely, when credit and liquidity wane, asset prices tend to experience a decline. This contraction signals a scarcity of funds for companies to leverage, hindering their capacity to invest and grow, which ultimately results in diminished revenues.
Given the recent banking turmoil and the provision of BTFP by the Fed in response to the collapse of SVB, I now take a more conservative view with my metrics for liquidity. The BTFP offers 1-year loans to banks and credit unions to help them meet the needs of depositors in the short term. Many currently believe this is QE, however, it isn’t in the conventional form. Therefore I prefer to look at only the ‘securities held outright’ when evaluating the Fed’s balance sheet. The two charts below show the disparity.
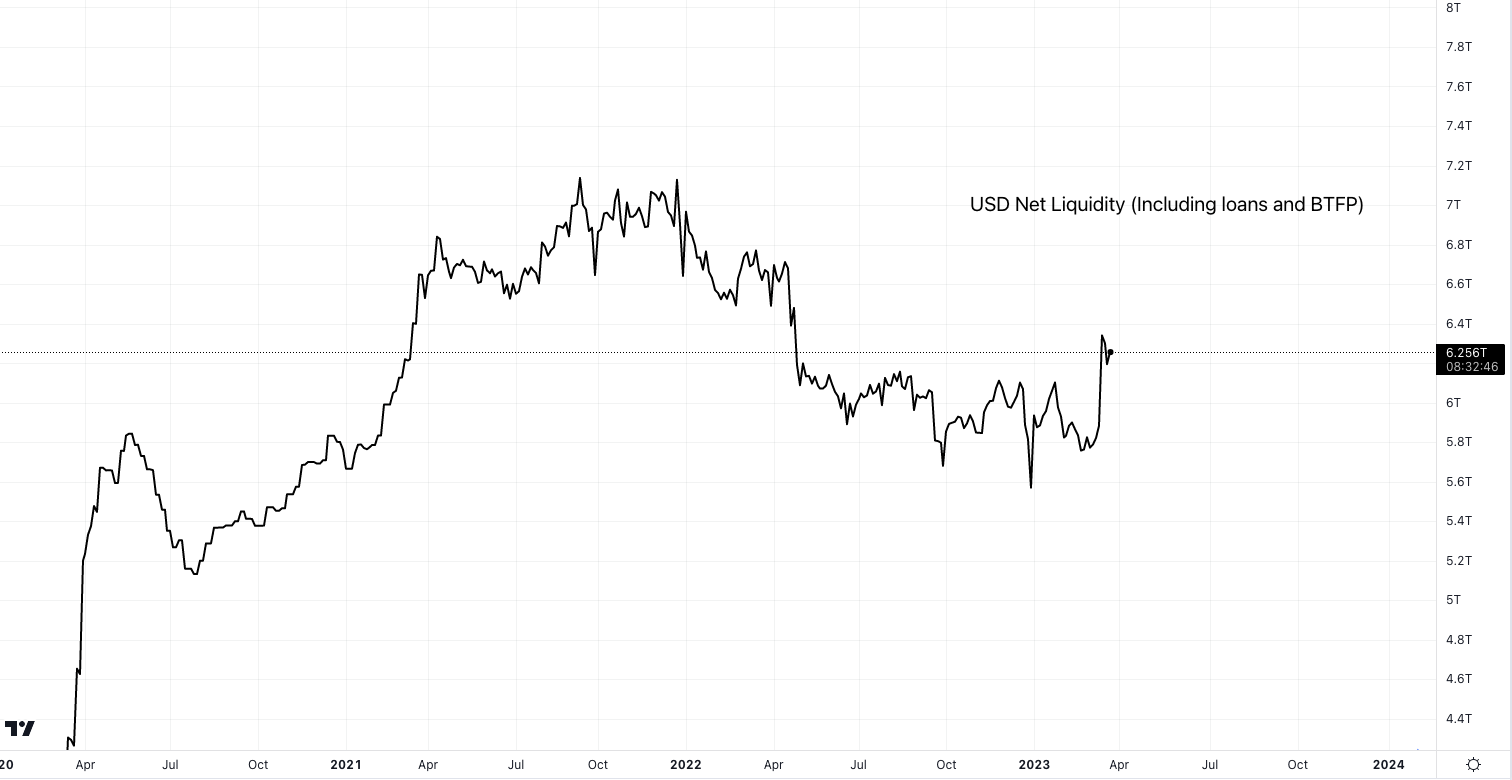
Figure 8 - USD liquidity including loans and BTFP. Source - TradingView

Figure 9 - USD liquidity only for ‘securities held outright’. Source - TradingView
When evaluating liquidity, we can also delve deeper into the interrelationship between the TGA, RRP and open market in an attempt to preempt asset price correlations. I touched on this in the following Twitter thread and wrote about it briefly in this article.


7. Inflation
Inflation - A measure of the rate at which prices for goods and services are increasing.
Elevated inflation may precipitate a decline in asset prices, as it gnaws away at the relative worth of investments. Additionally, it can dampen consumer spending and stifle economic growth. If inflation is too high, the economy will need to be tightened through interest rate rises thus bringing the metric back to normal levels - therefore high levels of inflation generally precede asset value drops.
Conversely, modest inflation can foster a rise in asset prices, signalling a healthy and stable economic landscape.
Governments usually unveil inflation data on a monthly basis, offering crucial insights to investors and policymakers alike. This data can be sourced from the website of the Bureau of Labor Statistics (BLS) in the United States.

Figure 10 - US Inflation rate YoY. Source - TradingView
8. Employment Levels
Employment Levels - The pivotal measure of workforce engagement within an economy.
Diminished unemployment rates often correlate with a robust economy and can stimulate a rise in asset prices. As more individuals secure employment and disposable income, consumer spending increases, potentially boosting companies' revenues.
The Non-Farm Payroll (NFP) serves as a monthly indicator that encapsulates the number of individuals employed in the US across manufacturing, construction, and goods sectors. This metric offers insights into the labour market's health, excluding farmworkers, private household employees, and non-profit organization staff.

Figure 11 - US unemployment rate. Source - TradingView
9. Housing Markets
Housing Markets - The intricate interplay of new home sales and construction, as well as the overall health of the mortgage market.
A vibrant housing market often drives asset prices upward, signalling a robust economy in which consumers possess the means to purchase homes. In contrast, a languishing housing market can trigger a decline in asset prices, as it reflects a weakened economy that could result in reduced revenues for construction and real estate companies.
My preferred approach to assessing the housing market's health is monitoring lumber prices as a broad indicator of construction demand. Elevated prices typically signify high demand and a flourishing market.
By creating a custom ticker of lumber prices against the price of Gold, a unique growth/value risk proxy indicator is derived. TradingView ticker = LBS1!/GOLD
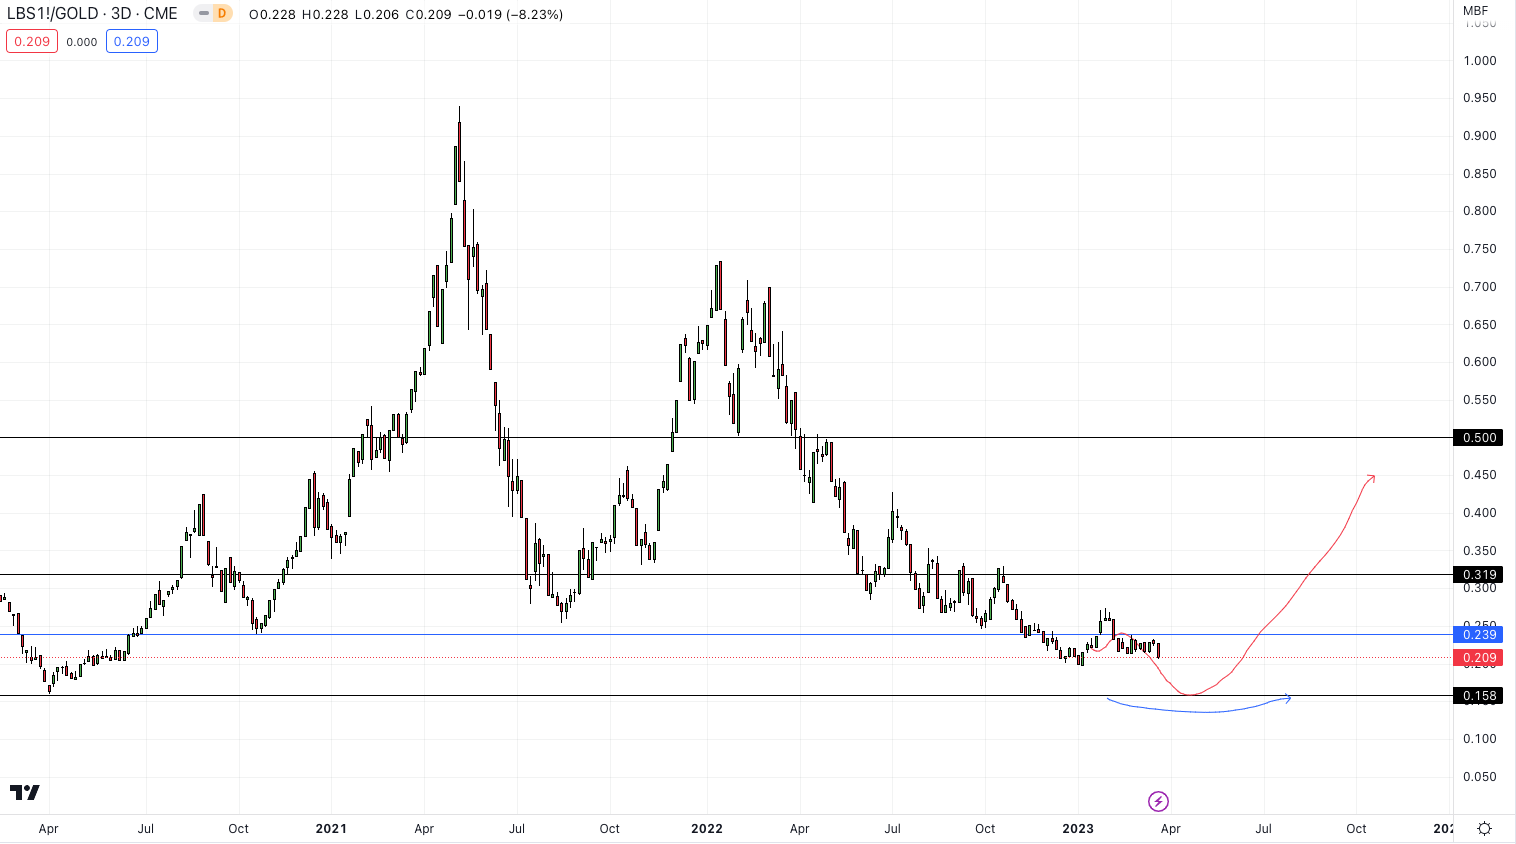
Figure 12 - Lumber/Gold ratio as a proxy for value/growth allocations. Source - TradingView
10. Geopolitical Events
Political/Geopolitical events - Events such as elections, war, and natural disasters, can have a significant impact on markets. A change in leadership, for example, can lead to uncertainty about the direction of the economy and can lead to volatility. It is important to be aware of the possible wider effects on the markets of these endo/exogenous threats and potential black swan events transpiring. Shock events usually yield the best opportunities if you are positioned correctly.
Some events I am watching closely:
- China reopening/relationship with Russia
- Russia/Ukraine war
- Bank of Japan - Yield Curve Control
- The volatile political landscape in Europe - French riots on the back of Macron’s forced raising of pension age
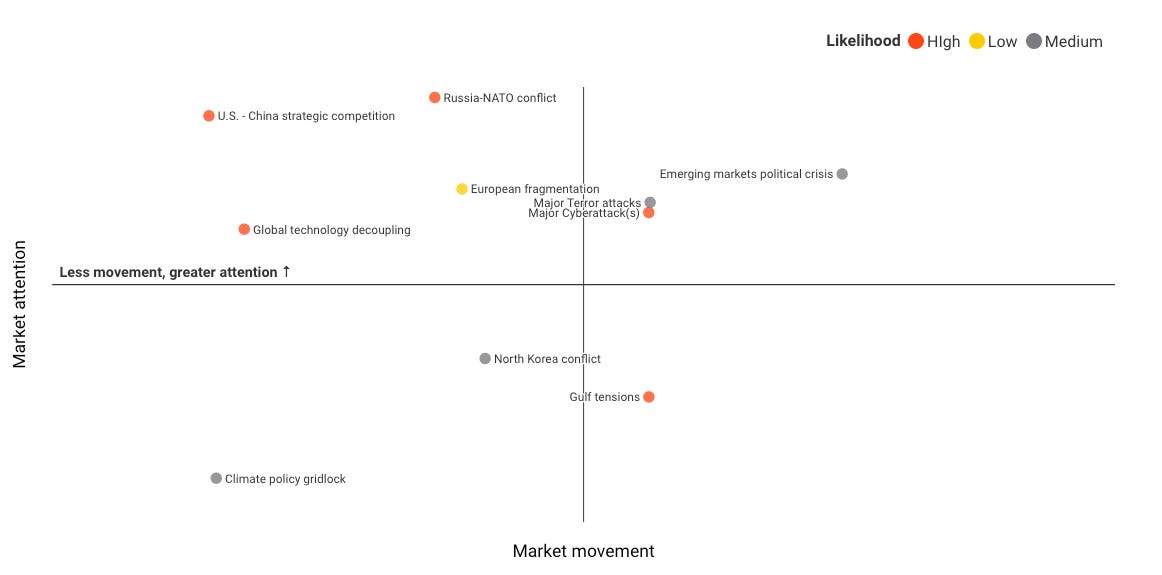
Figure 13 - Geopolitical risk map. Source - Blackrock Research
Conclusion
Determining the hierarchy of importance and the relative influence of the aforementioned ten indicators on asset prices presents a formidable challenge. The multifaceted nature of these economic factors and their interconnections create a complex web of cause and effect that varies significantly depending on the specific circumstances at play and the prevailing stage of the economic or business cycle.
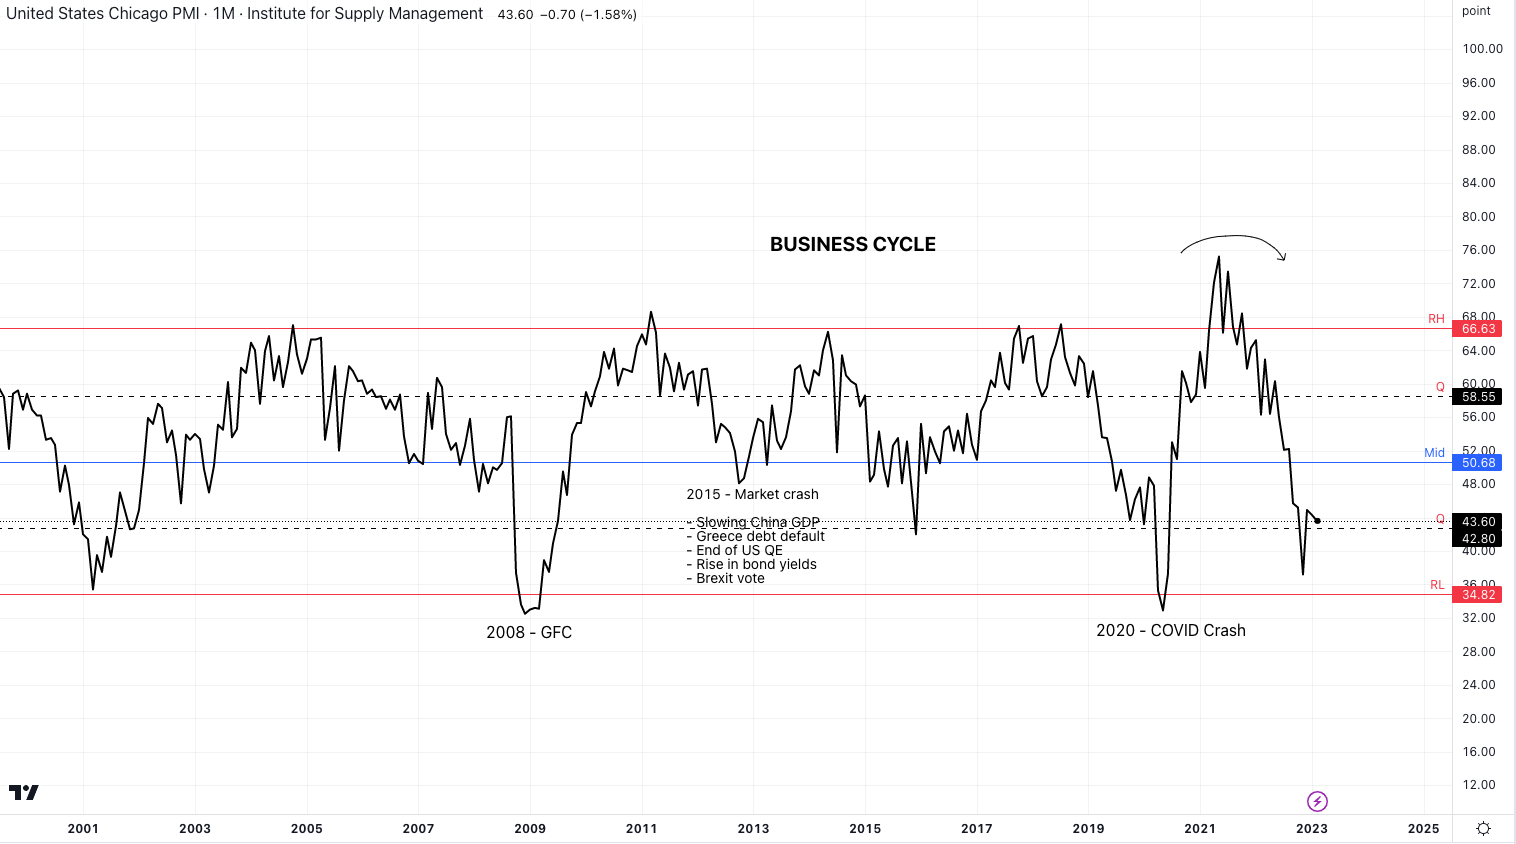
Figure 13 - Chicago PMI as a proxy for the US business cycle. Source - TradingView
Each indicator, while potent in its own right, interacts with others in intricate ways, creating a kaleidoscope of potential outcomes that defy simplistic classification. Moreover, the weight and impact of these factors shift dynamically as economies progress through different stages, rendering any attempt to rank them in a definitive order extremely difficult.
Thus, to fully appreciate and harness the power of these economic indicators, investors must remain cognisant of the ever-shifting landscape and adapt their strategies accordingly, embracing the complexity and fluidity inherent in the intricate dance of these influential forces.
Follow my Twitter account for regular updates on the progress of each of these indicators on the economic cycle alongside my personal views as to where opportunities lie in the financial markets.
🚨 Want to find your edge in markets? 🚨
My team and I are currently building “Asymmetry”, an elite, full-suite investment network designed exclusively for ambitious individuals seeking to advance their investment journey.
The dynamic discord community is dedicated to exchanging cutting-edge investment ideas, valuable data, and strategic trades while nurturing a collaborative environment that fosters personal and professional growth.
Check out our website and join the free announcement channel for further details.
Cool
nice